
Revenue and Margin analysis

Project Revenue (Billing) is the total amount of money a Customer pays for a project. We will be getting Billable amount from customer.

Cost is the total funds needed to complete the project or work that consists of a Direct Cost and Indirect Cost. We will be getting cost from in house finance team.

The Operating Margin measures how much profit a company makes from the project on a dollar of sales after paying for variable costs of production, such as employee wages, software and hardware, but before paying interest or tax.

Case study:

One developer working on a project which is planned to complete in one month (ie: 8 hrs/day * 20 days/month = 160 hrs).

Billable amount from the customer is 25$/hr and Cost from Employer is 20$/hr.
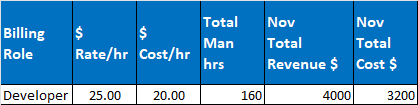

Revenue = $4000

Cost = $3200

Revenue Margin = Revenue - Cost = $4000-$3200 = $800

Revenue Margin Percentage (%) = (Margin/Revenue) * 100 = (800/4000)*100 = 20%

We can say that, the project is running with 20% profit.

 Assume due to incorrect project requirement analysis and design we have signed contract for one developer but to complete the project we need one more developer with 50% utilization.

Now we will calculate the profit of the above.


After added 80 hrs of additional effort

Revenue = $4000 (Remains same)

Cost = $4800 (increased from $3200 to $4800)

Revenue Margin = Revenue - Cost = $4000-$4800 = -$800

Revenue Margin Percentage (%) = (Margin/Revenue) * 100 = (-800/4000)*100 = - 20%

We can say that, the project is running with 20% loss.


Operating margin is a key metric for measuring a company's profitability from operations. It's calculated as the ratio of operating profits to revenue, expressed as a percentage. A higher operating margin is generally better because it indicates that a company can generate a significant profit from its operations. A healthy operating margin for a software company is generally between 10% and 30%, but it's important to compare it to industry peers for a proper assessment. 

The formula for operating margin is:

Operating Margin = Operating Earnings / Revenue
 
For example, if a company had revenues of $2 million, COGS ( cost of goods sold) of $700,000, and administrative expenses of $500,000, its operating earnings would be $2 million - ($700,000 + $500,000) = $800,000. Its operating margin would then be $800,000 / $2 million = 40%.


Comments

Popular posts from this blog

New way of product development

Today is the era of fast-paced world and competitive world. Companies are realizing that the old sequential approach to developing new products won’t get the job done and product can’t be reached to market when compared to competitors. The 4 stages of product development are as follows – R&D, Growth, Maturation, and Decline. Instead of sequential approach, companies are using holistic approach – as in rugby game, the ball gets passed within the team as it moves as a unit up the field. This holistic approach has six characteristics: 1)     Build-in-instability 2)   Self-organizing project teams 3)   Overlapping development phases 4)   Multi-learning 5)   Subtle (very clear and strong) control 6)   Organizational change to explore and learning The above six characteristics forming a fast and flexible process for new product development with advantage of act as a change agent, creative, market driven ideas, flexi...

Product Manager vs Product Owner

Both the product manager and the product owner work towards a common goal, to build and improve products that create meaningful value for customers and all stakeholders within the company. This usually happens by delivering and optimizing product features. Product Manager Product Owner The product manager discovers what users need, prioritizes what to build next, and rallies the team around a product roadmap. The product owner is responsible for maximizing the value of the product by creating and managing the product backlog. This person creates user stories for the development team and communicates the voice of the customer in the Scrum process.      Product Manager and Product Owner's work on below vacuum. Product manager focus on: Business Strategy Long term Product Vision Long term Product Strategy Product Roadmap Alignment with Product Owner Product owner focus on: Release Plan (Product Backlog ie: ...

Data & Analytics

Data and analytics is the management of data for all uses and the analysis of data to drive business processes and improve business outcomes through more effective decision making and enhanced customer experiences. Four Types of data analytics: 1.         Predictive data analysis Predictive analytics may be the most commonly used category of data analytics. Businesses use predictive analytics to identify trends, connections between data, and relationship between data. 2.        Prescriptive data analytics Prescriptive analytics is where AI and big data combine to help predict outcomes and identify what actions to take. Prescriptive analytics can help answer questions such as “What if we try this?” and “What is the best action?” You can test the correct variables and even suggest new variables that offer a higher chance of generating a positive outcome. 3.        Diagnostic data analyti...