Root Cause Analysis (RCA) in Lean Six Sigma
Using 5 Whys and Fishbone (Ishikawa) Diagram


What is Root Cause Analysis (RCA)?
Root Cause Analysis is a structured problem-solving approach used in Lean Six Sigma to identify the real cause of a problem—not just its symptoms.
Goal: Fix the problem once and permanently, not repeatedly.
RCA is mainly used in the Analyze phase of DMAIC.
Why RCA is Critical in Lean Six Sigma
Prevents recurring defects
Avoids “quick fixes”
Reduces waste and rework
Enables sustainable improvement
Supports data-driven decisions
Two Most Powerful RCA Tools
Lean Six Sigma commonly uses:
5 Whys
Fishbone (Cause-and-Effect) Diagram
They are often used together.
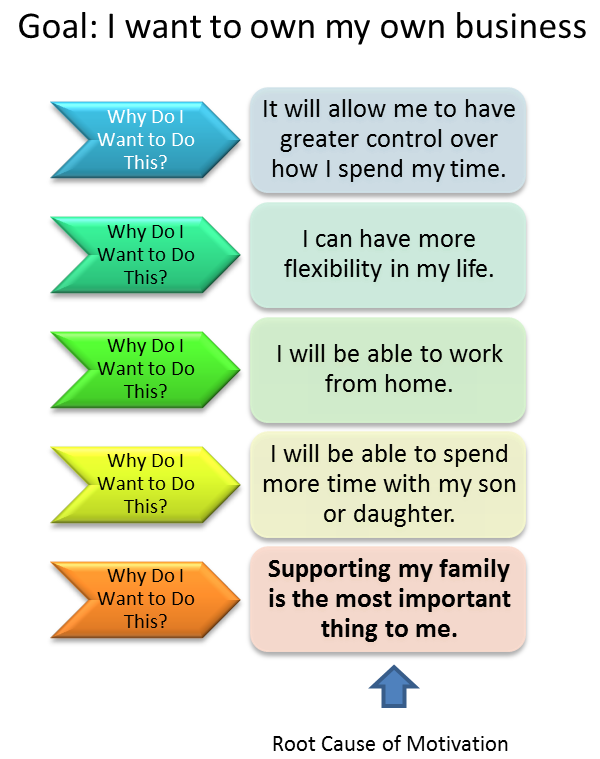
1️⃣ 5 Whys Technique
What is 5 Whys?
The 5 Whys is a simple questioning technique where you repeatedly ask “Why?” until the root cause is revealed.
📌 Usually 5 times—but it can be 3 or 7, depending on the problem.
5 Whys – Example
Problem Statement
❌ Customer received wrong invoice
| Why? | Answer |
|---|---|
| 1️⃣ Why was the invoice wrong? | Incorrect data was entered |
| 2️⃣ Why was incorrect data entered? | Operator selected wrong customer |
| 3️⃣ Why did operator select wrong customer? | Customer names look similar |
| 4️⃣ Why do names look similar? | System does not show unique ID clearly |
| 5️⃣ Why doesn’t system show unique ID? | Design requirement was missed |
✅ Root Cause
👉 System design does not enforce unique customer identification
When to Use 5 Whys
✔ Simple problems
✔ One main cause suspected
✔ Small teams
✔ Fast analysis
Limitations
❌ Can be subjective
❌ Depends on facilitator skill
❌ Weak for complex problems
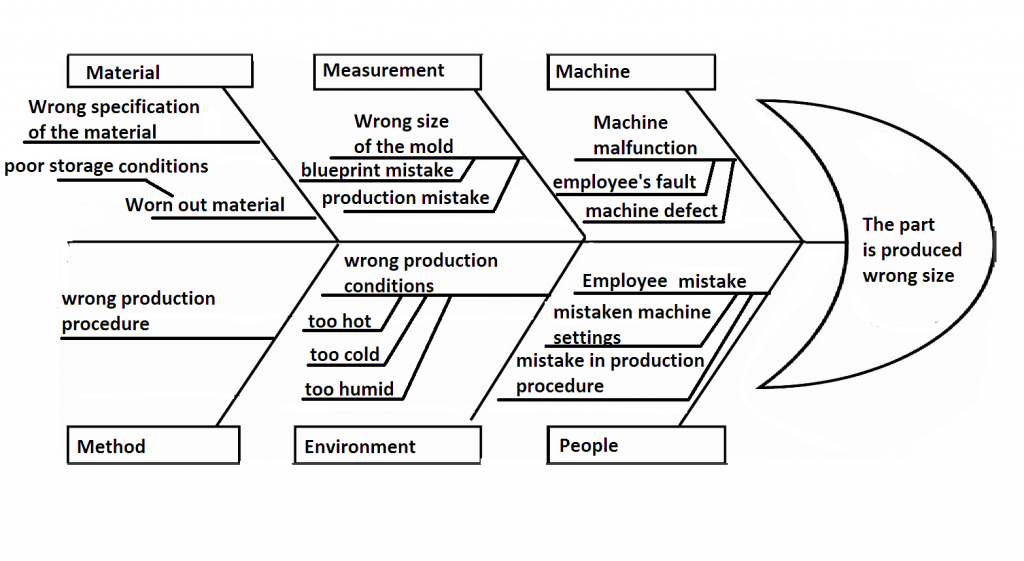
2️⃣ Fishbone Diagram (Ishikawa)
What is a Fishbone Diagram?
The Fishbone Diagram visually maps all possible causes of a problem under logical categories.
It answers:
What are all the possible reasons this problem could occur?

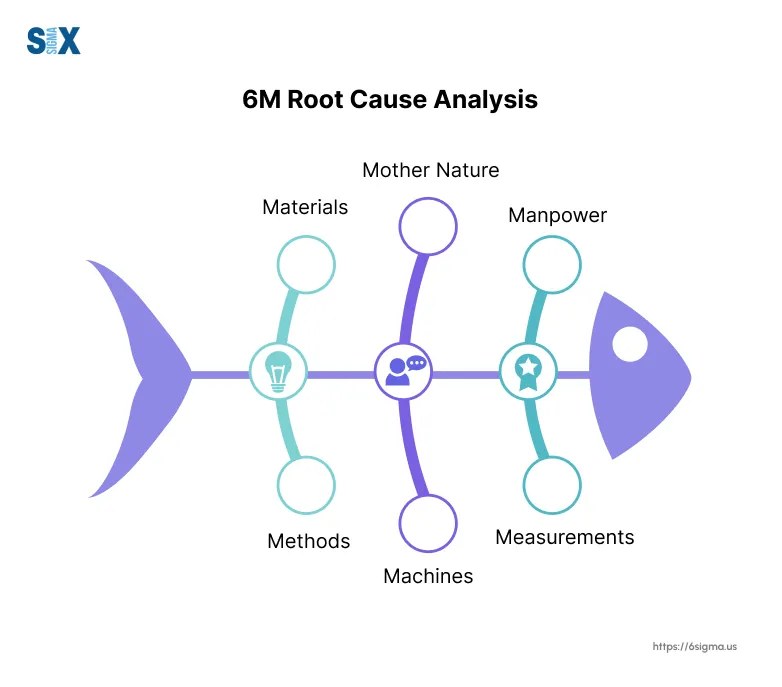
Common Fishbone Categories (6M)
Manufacturing (6M)
Man – People, skills, training
Machine – Equipment, tools
Method – Process, SOP
Material – Raw materials
Measurement – Data, metrics
Mother Nature – Environment
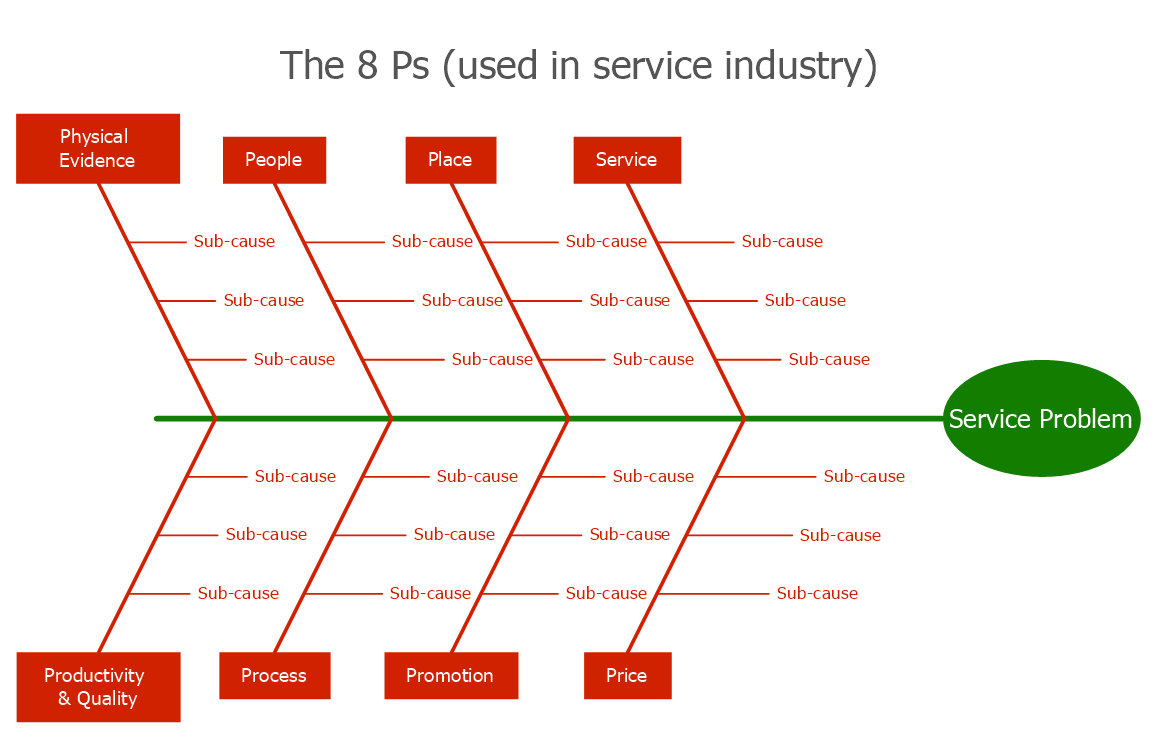
Service / IT (often adapted)
People
Process
System
Policy
Data
Environment
Fishbone – Example
Problem
❌ High order delivery delay
Possible causes identified:
People: New staff, inadequate training
Process: No standard delivery workflow
System: ERP downtime
Measurement: No delivery SLA tracking
Environment: Traffic, weather
👉 After brainstorming, data analysis confirms:
70% delays due to missing standard process
✅ Root Cause
👉 Lack of standardized delivery process
How 5 Whys and Fishbone Work Together (Best Practice)
| Step | Tool |
|---|---|
| Brainstorm all possible causes | Fishbone |
| Narrow down key causes | Data analysis |
| Drill into true cause | 5 Whys |
| Validate cause | Evidence |
| Fix permanently | Improve phase |
📌 Fishbone = Wide view
📌 5 Whys = Deep dive
Common Mistakes to Avoid ❌
Jumping to solutions too early
Stopping at symptoms
Blaming people instead of process
Not validating causes with data
Treating assumptions as facts
Lean Six Sigma Golden Rule ⭐
If you remove the root cause, the problem will not return.
If the problem returns, the root cause was not removed.
Short Summary
Root Cause Analysis in Lean Six Sigma is used in the Analyze phase to identify the true cause of defects.
Fishbone diagrams identify all possible causes, while 5 Whys drills down to the actual root cause for permanent improvement.
Comments
Post a Comment